How we loaded 300 packages into 4 trucks in 1.3 seconds
A complete run with 300 synthetic deliveries spread over the real road network of Querétaro, Mexico. These are the numbers, including the ones that don't flatter the algorithm.
The instance
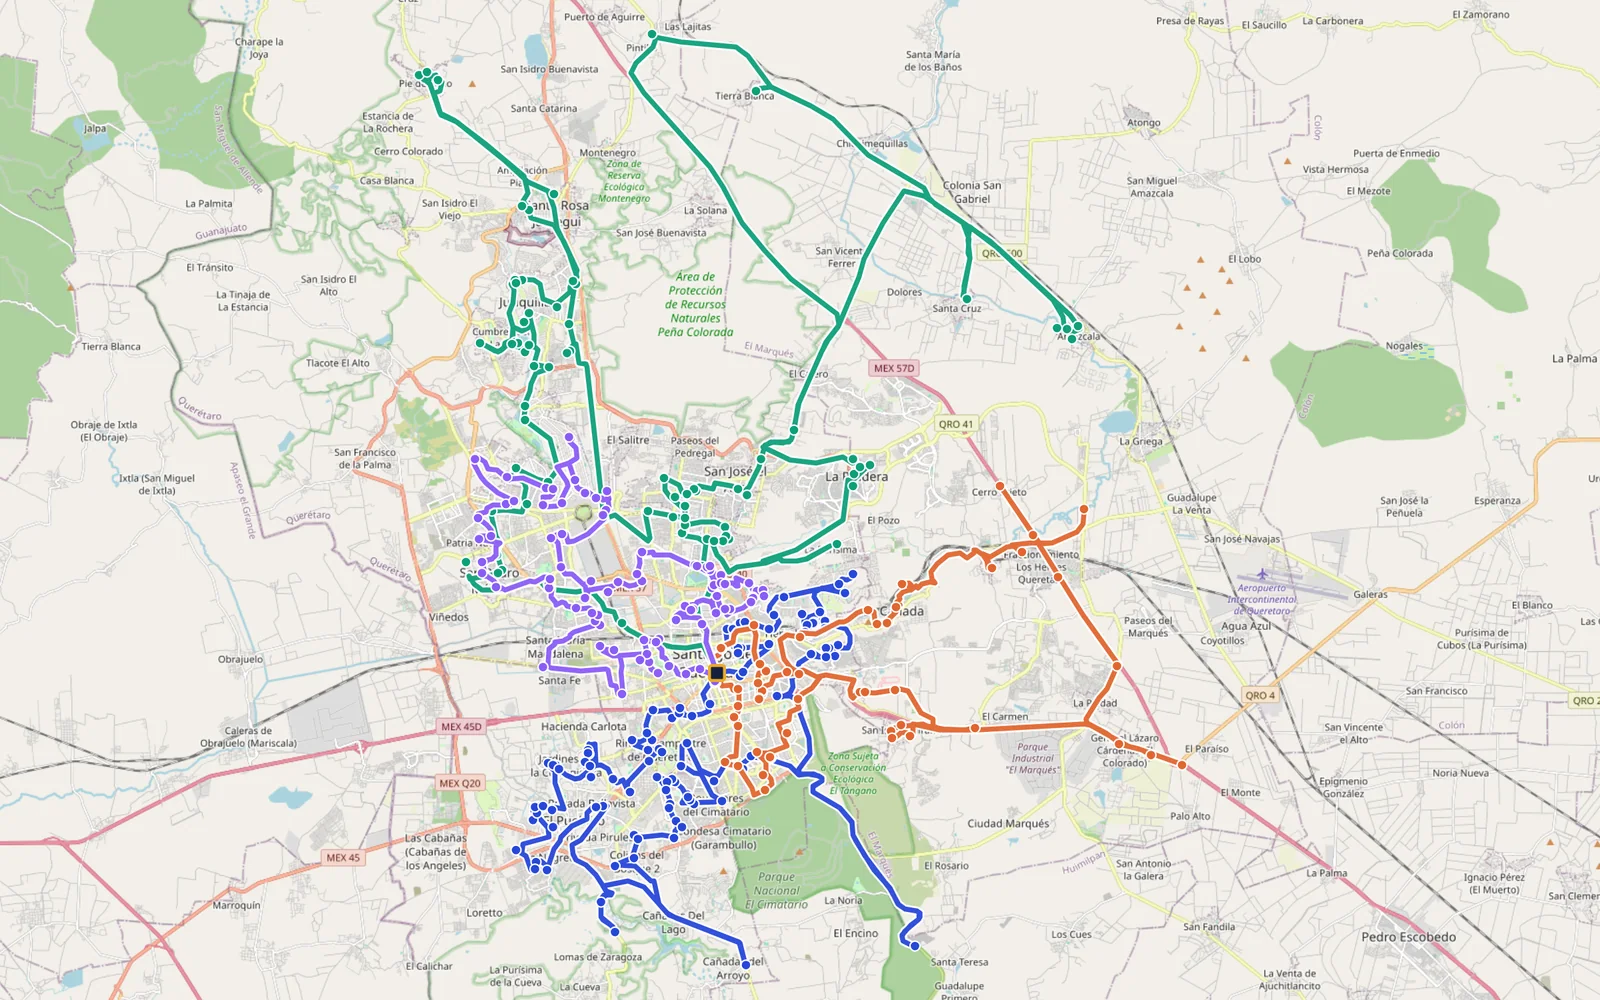
300 deliveries placed on real nodes of the Querétaro road network extracted from OpenStreetMap, with per-package dimensions and weights ranging from 20 × 15 × 10 cm boxes weighing 400 grams up to 80 × 50 × 40 cm parcels of almost 19 kilograms. A mixed fleet of four vehicles: a high-roof van with a 365 × 139.2 × 164.8 cm cargo area and a 1,900 kg payload, a panel van of 339.5 × 149 × 157 cm and 1,351 kg, and two compact vans of 200 × 150 × 150 cm and 600 kg. Active constraints: minimum support, fragility and LIFO unloading.
The results
| Metric | Value |
|---|---|
| Planned deliveries | 300 |
| Vehicles used | 4 |
| Total distance (road network) | 519.54 km |
| Total operating cost | MXN 5,319.96 |
| Average cost per delivery | MXN 17.73 |
| Average volume occupancy | 60.2% |
| 3D loading time (300 boxes) | 1.34 s |
Per route: 98, 73, 49 and 80 packages, with distances of 138.4, 198.9, 98.6 and 83.6 km. The asymmetry is not a bug: the 98-delivery route covers the dense downtown area, where stops are a few hundred meters apart; the 73-delivery route heads out to the periphery, where every customer costs kilometers.
Why occupancy stays at 60%
It's the question everyone asks the first time they see the loading diagram. The answer is geometry, not inefficiency. When every box must have at least 75% of its base supported, nothing heavy may rest on a fragile parcel, and the packages for stop 12 must come out without moving those for stop 13, the truly usable space falls far below the nominal volume.
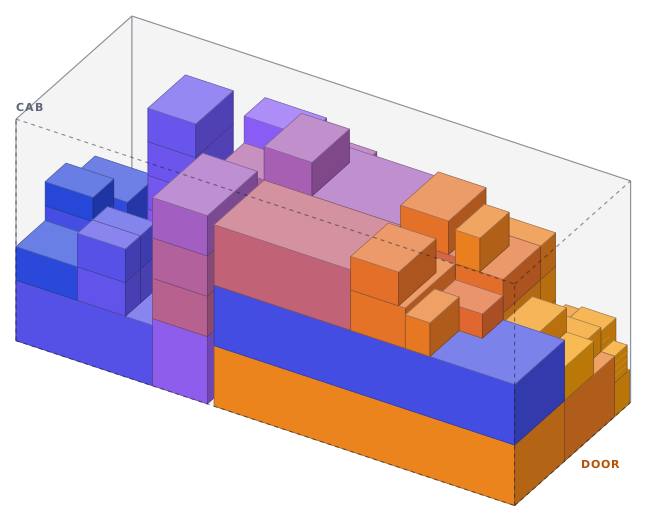
The practical takeaway: if your planning system assumes that an 8.3 m³ vehicle accepts 8.3 m³ of goods, it is building routes the loading dock won't be able to load. We route with a calibrated effective capacity—roughly 51% to 59% of the nominal volume depending on the active constraints—and the result is plans that run without last-minute fixes.
The cost of geometry
Here is the uncomfortable number. If the same instance is solved as a classic CVRP, ignoring the third dimension, the total distance drops to 431.7 km. In other words, accounting for real loading cost 87.8 extra km, 20% more.
That difference is not a loss by the algorithm: it is the price of feasibility. The 431 km routes exist on paper and cannot be loaded. Any tool that boasts much shorter distances is probably solving an easier problem than the one you have at the loading dock.
What failed and how we fixed it
The first version of the system let the routing engine work with the nominal volume and relied on a mediator to repair unloadable routes afterwards. It worked, but at a cost: in the formal evaluation on the Gendreau instances, the repair achieved feasibility at the expense of 13.7% extra distance, and 36.6% in the worst case.
The change was to move the constraint forward instead of repairing backwards: route from the start with an effective capacity calibrated per variant. In smoke tests the mediator sat idle—zero repairs—and in the loading-only variant the distance fell from 429.6 to 329.3 km. The lesson is old but often forgotten: in combinatorial optimization it pays to charge the constraint in the cost function, not in a later patch.
Reproducibility
The results come from a logged run of the planner, with a shortest-path matrix over the road network, a fuel price of MXN 24.50/L and real fuel economy per vehicle. The map, the loading diagram and the charts in this article (and the site demo) are drawn from that run's data: the diagram shows the exact positions computed for the 98 packages of route 1, not an illustration.
Further reading
The base problem is formulated in what is the CVRP (in Spanish), and the three-dimensional constraints are detailed in 3L-CVRP (in Spanish). If you want to try your own data, the Planner takes a distance matrix and a list of packages.
See LATTIMEX with your own deliveries
In the assessment we measure your current routes and show you, with your own orders, how kilometers, vehicles and loading change.
Request a demo